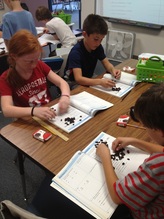
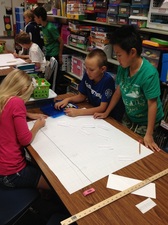
We happen to be at a point in the year where there is some similarity in what we are studying in two of my classes. Both 4th and 5th grade math have been constructing and analyzing graphs for the past two weeks. 4th graders have been bar graphing their head sizes and determining the average box of raisins while 5th grade has been conducting surveys to create pie graphs, line plots, and stem and leaf plots. Each grade level needs to be competent at understanding types of graphs. Both grade levels are expected to be able to determine landmarks - range, median, and mode. Fourth graders are introduced to the idea of mean (average) while 5th graders need to master the computation involved in figuring out the mean (remember 4th graders haven't tackled long division yet - we will though!) This is one of the times in the year where it is evident how math is a spiraling subject area. What we teach one year spirals back the next year in a slightly different and more challenging manner. While the fourth graders created their first line plot, 5th graders create their first pie graphs. While fourth graders master reading and interpreting the data on graphs, 5th graders look into how graphs can be skewed to persuade an audience. While fourth graders look at how graphs show up in our daily lives, 5th graders begin to evaluate the uses for knowing the landmarks such as the mode of a given set of data or the mean of a set of numbers. Take a minute to ask your student about some of the fun, engaging activities we have done to reinforce data collection and data analysis. Then go check out the pictures in the photo gallery of two of our activities.
0 Comments
Leave a Reply. |

Tracey BeanWerner Elementary Archives
May 2018
Sign-up for updates: |
| Knowledge Peak | Blog |
 RSS Feed
